Since you’ve found your way all the way here, we believe you know why we need to address the topic of sustainability. If everyone in the world consumed as we do in Finland, we would need 3.8 Earths. As we only have one, something needs to be done.
Simply, we need to reduce global greenhouse gas emissions in order to limit the global temperature increase. All of us – consumers, companies and governments – need to take a role in this joint effort. Everything counts, from implementing tiny tweaks to daily routines and introducing new legislation.
It should be easy for consumers to make sustainable decisions which is one of the reasons why we support a standardized way of measuring CO2eqv* emissions. What’s on your plate truly matters, as today’s food supply chain creates ~13.7 billion metric tons of carbon dioxide equivalents, which adds up to 26% of anthropogenic GHG emissions (Poore, J and Nemecek T 2018). Confused? In plain English, the food supply chain makes up over a quarter of the total pollution we humans are responsible for.
*CO2eqv includes CO2, CH4 and N2O emissions.
We hope that in a couple of years everyone will understand whether 1.37KG/CO2eqv per KG of food is a high, reasonable, or low number. We are not there yet but we will try to support you as much as possible on this journey towards more sustainable consumption. Let’s start with showcasing some numbers – we love numbers!
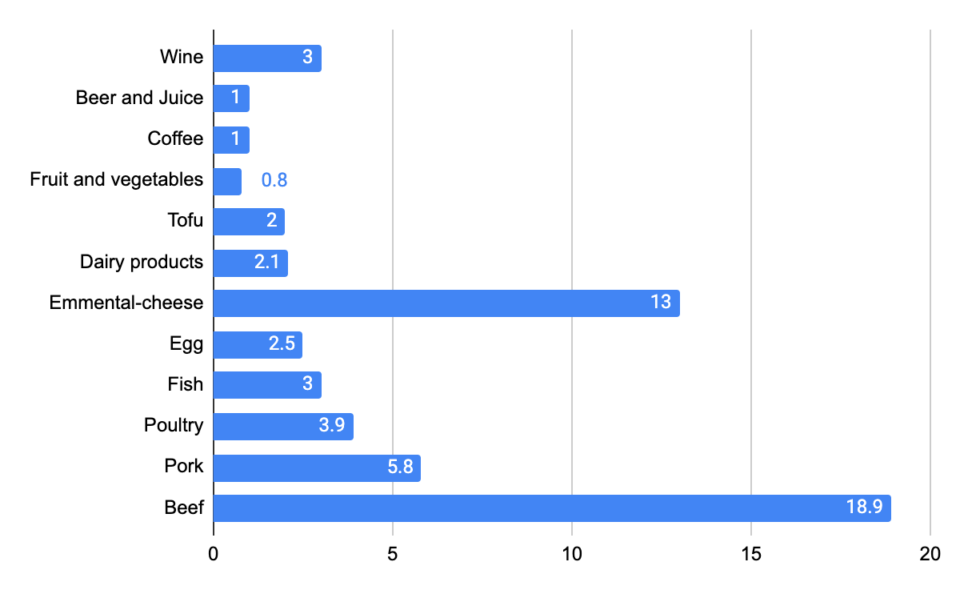
KG CO2e / KG of food Source: Sitra (2019) https://www.sitra.fi/en/articles/carbon-footprint-average-finn/ According to Sitra, these figures are estimations and not based on scientific calculations. For instance, according to FAO, the global average of dairy’s CFP is 2.5CO2eqv.
So what do these figures actually mean? They mean that you could eat 1kg of dairy cow beef, 42kg of peas, 28kg of potatoes, 2.2 kg of pork, or 2.9kg of poultry and end up with the same GHG emissions with all alternatives. Okay, and how do these figures compare to our Grill Sausage?
We conducted a carbon footprint calculation on our products to find out which part of our supply chain creates the most emissions. Our CFP calculation was conducted by D.Sc.(Tech) Tuula Pohjola, CRnet Ltd. The calculation is based on Pohjola’s doctoral thesis “Environmental Modelling System – A Framework for Cost-Effective Environmental Decision-Making Processes” (Helsinki University of Technology, 1999). The method for the calculating of CFP is presented in the thesis and it includes the modelling of determining the factors of environmental factors.
The determination and calculation of CFP are based on the following standards:
• BSI (British Standard) PAS 2050 (CFP calculation)
• ISO/TS 14067 (CFP calculation of products and the communication of results)
- ISO/TR 14069 (Determination of greenhouse gases).
Raw materials – The first phase of calculating CFP includes CFP values of raw materials, all distances and vehicle types of the whole supply chain from the first supplier to Meeat’s supplier, and transportation to the factory in Kannus.
Manufacturing at the factory – Manufacturing includes the CFP values of the factory’s energy consumption, water consumption, and cleansing, as well as waste management.
Packaging – Packaging includes CFP of packaging materials and CFP of packaging materials’ transportation to the factory.
Staff transportation – Staff transportation includes CFP of commuting by car between home and work (21.5 days a month and 11 months in a year).
Distribution (factory to distribution centre) – Distribution phase 1 (from the factory to the distribution centres) includes the calculation of CFP transportation (Eur6 type).
Distribution (distribution centres to stores) – Distribution phase 2 (from the distribution centre to stores) includes the calculation of CFP transportation (Eur6 type).
In total, our Grill Sausage is at 1.37KG CO2eqv per KG food, which includes everything from raw materials to distribution to stores. When we compare these figures, it becomes evident that we can produce ~12.5KG of food compared to beef. Even if your beef of choice came from the most sustainable farm possible, we could still produce ~6.7KG of food with the same GHG emission.
Finns eat 18.8kg of beef, 26.6kg of poultry, 30.8kg of pork and 14.9kg of fish annually (Natural Resources Institute Finland 2020). By swapping every second meal to Meeat, you would save 278KG of Co2eqv and lower your personal emissions by nearly 41%. By swapping 100% of your meals to Meeat, you would save 557KG of Co2eqv and lower your personal emissions by nearly 82%. Doesn’t that sound amazing? According to The Finnish Innovation Fund Sitra’s analysis (2020), we need to lower our emissions by 90% until 2050 to reach the goals of Paris Agreement, so let the Meeat journey begin!
We as a company have the responsibility to make our products as sustainable and healthy as possible. However, our number one goal is to make them tasty because let’s be honest: the biggest impact we as a plant-based company can have is to make it easy for you to swap meat to Meeat every now and then. Unlike with many other companies, the more we grow, the better it is for the planet. We are not urging people to consume more – we are here to provide you with an easy, better and most importantly tasty alternative for meat.
We will thrive to do better on every step of our journey but these are the cornerstones we will always come back to – our promises:
- We will make it as easy and tasty as possible for every person out there to swap meat to Meeat.
- We will climate calculate all our products.
- In all decision-making, we will make the most sustainable decision possible. However, we will not compromise taste and texture – they are our priority.
- We stand for a standardized way of calculating climate footprint and are more than willing to join forces with the entire industry to define this framework.
References:
Natural Resources Institute Finland 2020. What was eaten in Finland in 2019? Available at: https://www.luke.fi/en/news/what-was-eaten-in-finland-in-2019/ Accessed: June 29th, 2021
Pohjola, Tuula 1999. Environmental Modelling System – A Framework for Cost-Effective Environmental Decision-Making Processes. Helsinki University of Technology.
Poore, J and Nemecek T 2018. Reducing food’s environmental impacts through producers and consumers. Science Vol. 360, Issue 6392, pp. 987-992. Available at: https://science.sciencemag.org/content/sci/360/6392/987.full.pdf?ijkey=ffyeW1F0oSl6k&keytype=ref&siteid=sci Accessed: June 29th, 2021
The Finnish Innovation Fund Sitra 2018 (figures updated in 2019). Carbon footprint of the average Finn. Available at: https://www.sitra.fi/en/articles/carbon-footprint-average-finn/ Accessed: June 29th, 2021
The Finnish Innovation Fund Sitra 2019. 1.5-degree lifestyles. Available at:
https://www.sitra.fi/en/publications/1-5-degree-lifestyles/ Accessed: June 29th, 2021